You've spotted what looks like a perfect breakout. The price pushes through resistance, and you enter long — confident this is your trade. Ten minutes later, the price reverses hard, stops you out, and then drifts back into the range like nothing happened.
This happens to every trader at some point. Usually more than once. The problem is often watching price while ignoring volume. Price shows what’s happening, volume shows conviction. Without it, you’re trading half-blind.
In this post, you'll learn exactly what volume analysis is, why it gives futures traders a unique advantage, and how to use it to confirm trends, spot reversals before they happen, and avoid the liquidity traps that punish inexperienced traders.
What Exactly is Trading Volume?
At its core, trading volume is simple. It's the total number of contracts that changed hands during a specific time period. Every time someone buys a contract, someone else sells it. That transaction adds that trade’s contract size to the volume total.
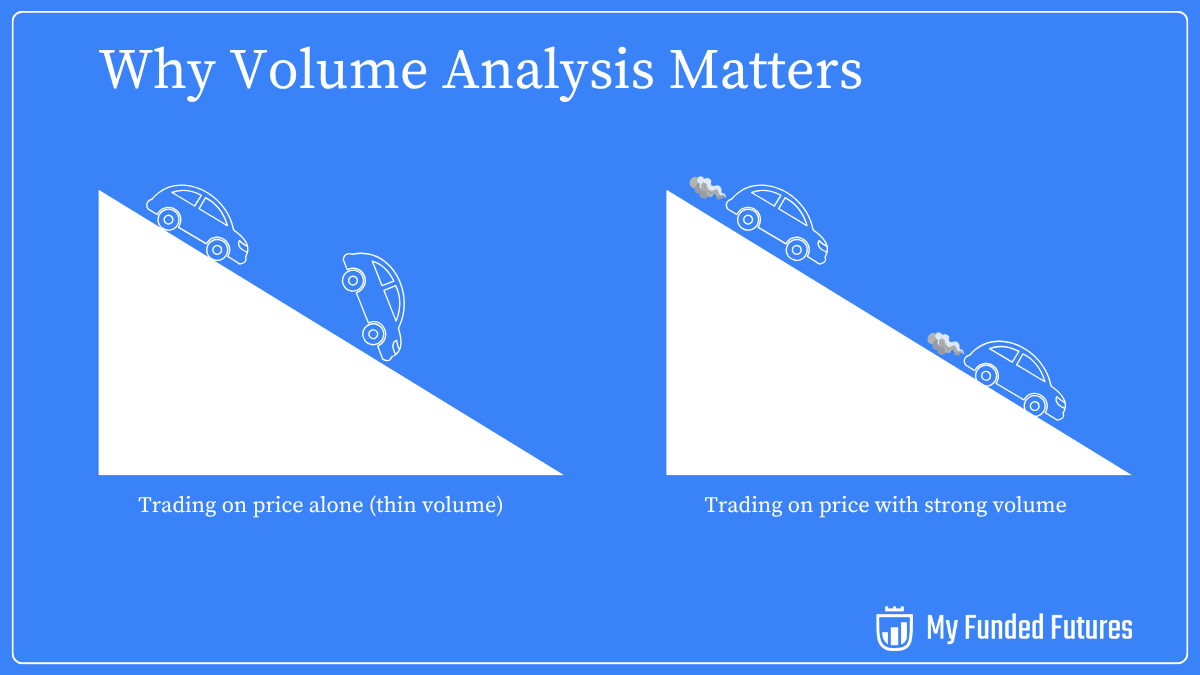
Think of volume as the fuel behind price movement. A car can roll downhill without the engine running, but that doesn't mean it has real power. The same applies to price moves. When prices surge on thin volume, you're watching a car coast, not accelerate. It looks impressive until gravity takes over, and the move collapses just as quickly as it started.
Futures traders have a massive advantage over their counterparts in other markets here. Unlike decentralized markets like spot forex, where you can only see the volume from your specific broker, futures exchanges like the CME provide actual, centralized volume data. Every single contract traded on the exchange is recorded and reported. The volume you see on your charts represents real market activity across the entire exchange, not just a slice of it. That reliability makes volume analysis significantly more powerful for futures traders.
Ready to trade with the full force of Volume Analysis Behind You? Get Funded Now
Why Volume Analysis is a Trader's Secret Weapon
Volume reveals the market's underlying psychology beyond what price action alone can show you. Here’s how:
Confirming Trend Strength & Conviction
Strong trends move in one direction with increasing participation.
In a healthy uptrend, you should see volume expand as the price pushes higher and contract during pullbacks. Each new leg up should carry more weight than the last, confirming that buyers are stepping in with increasing aggression. That's bullish conviction in action.
The opposite holds for downtrends. When prices fall to new lows, volume should rise on those down moves and fade during the relief bounces. This tells you that the market is falling because sellers are actively forcing it down while buyers remain hesitant.
When you see this pattern, you can trade with confidence. The trend has fuel in the tank.
Spotting Trend Weakness and Reversals (Divergence)
Volume analysis becomes your early warning system when you learn to spot divergence.
Volume divergence occurs when price makes a new high or low, but the volume on that move is noticeably lower than the volume on the previous high or low. This mismatch is a red flag. The price is trying to extend, but fewer traders are willing to participate.
In an uptrend, if the price pushes to a new high on declining volume, it suggests that the buying enthusiasm is fading. The smart money might already be exiting while late arrivals push the price just a bit higher. This divergence often precedes a reversal, warning you to tighten stops, take profits, or prepare for a counter-trend trade.
Identifying Market Exhaustion and "Blow-Off" Tops
Trends don’t always fade quietly. Sometimes they explode.
A climactic volume spike happens when volume suddenly surges far beyond its recent average at the peak of a sustained move. This often marks the final push as retail traders pile in at the worst possible moment, convinced they're missing out, while institutional players quietly distribute their positions into that liquidity.
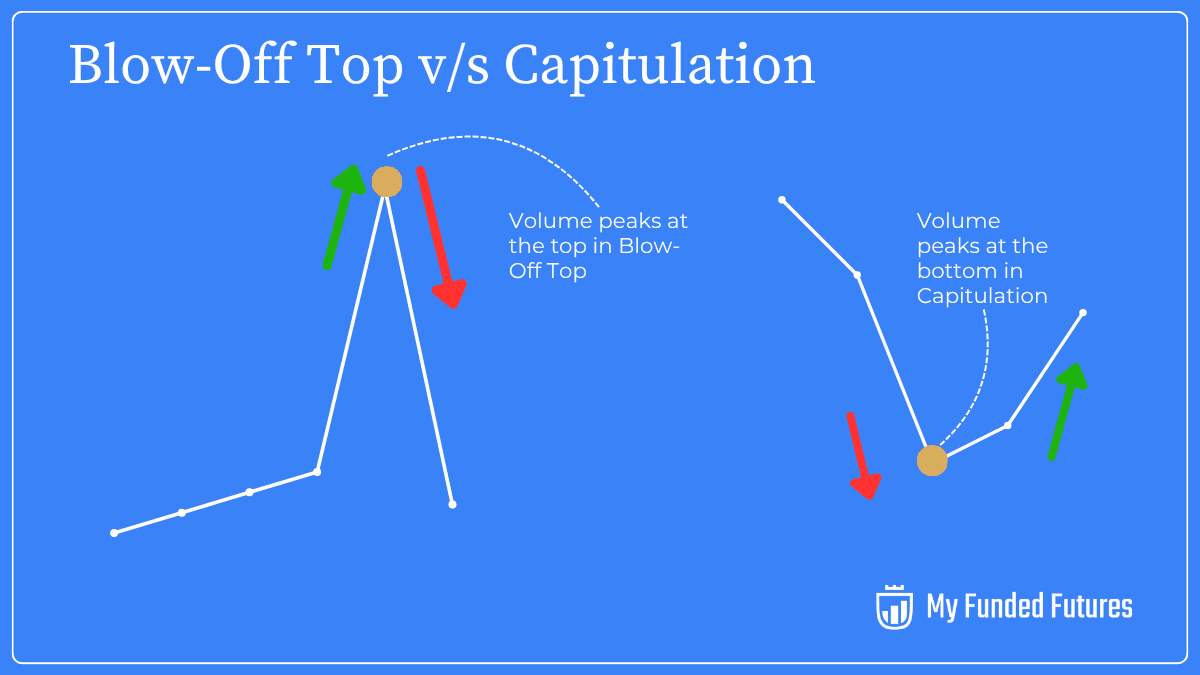
You may have seen this before. A stock or futures contract that's been grinding higher for weeks suddenly rockets upward in a single session on massive volume. It feels like the trend is accelerating, but in reality, it's exhausting itself. This is called a blow-off top. The same phenomenon occurs in reverse at market bottoms, where panic selling creates a capitulation event with enormous volume as “paper hands” finally give up.
These spikes don't guarantee an immediate reversal, but they demand caution. The market has just burned through a tremendous amount of energy, and what follows is often consolidation or a sharp reversal.
Avoiding False Breakouts and Liquidity Traps
Not all breakouts are created equal.
When price breaks through a key support or resistance level, your first instinct might be to jump in. But before you do, check the volume. If the breakout happens on low volume, treat it with suspicion. A breakout without broad participation is fragile. It suggests that only a small group of traders pushed the price through that level, and once they're done, there's no one behind them to sustain the move.
Often the price snaps back, trapping traders who relied only on price patterns.
A genuine breakout will often show a clear surge in volume as traders from both sides of the market rush to act. That's the confirmation you need before committing capital.
Avoiding false breakouts is just one way to trade smarter! Test your skills in a secure environment
Practical Tools for Volume Analysis
Now that you understand the principles, let's talk about the tools that make volume analysis practical and actionable.
Reading the Simple Volume Bar
Every charting platform displays volume as a series of vertical bars beneath the price chart. The height of each bar represents the total contracts traded during that period.
The key is to compare each bar to the recent average. Is today's volume higher or lower than the past 10 to 20 bars? A sudden spike tells you something important just happened. A gradual decline suggests waning interest. These bars are your first line of analysis, and they're often all you need to confirm or question a price move.
On-Balance Volume (OBV) and the Cumulative Story
On-Balance Volume takes a different approach by creating a running total instead of showing raw volume for each period. When the price closes higher than the previous close, that period's volume is added to the OBV. When the price closes lower, the volume is subtracted.
OBV smooths out the noise and shows you the cumulative flow of volume over time. If the price is making new highs and the OBV is also making new highs, you have confirmation that buying pressure is genuinely building. The trend is healthy.
But when the price makes a new high and the OBV fails to follow, that's divergence. The indicator is telling you that despite the higher price, the cumulative buying pressure is weakening. This often precedes a reversal, making OBV a popular and useful tool for spotting trend exhaustion before it's obvious on the price chart.
Volume Profile and Seeing Price from a Different Angle
Most traders think of volume as something that happens over time. Volume Profile flips that perspective. It displays volume as a horizontal histogram, showing you how much volume was traded at each specific price level, not just when it was traded.
This gives you a completely different view of market structure. Here are the key concepts.
The Point of Control (POC) is the price level where the most volume was traded. Think of it as the market's center of gravity. POC tends to act as a magnet in balanced conditions because that's where the most participants agreed on value. When price moves away from the POC, it often gets pulled back. When it breaks away decisively, the market is reassessing value.
The Value Area (VA) represents the price range where approximately 70% of the volume occurred. This is the zone the market considers fair value. Prices outside the value area are considered either cheap (below) or expensive (above), which can create opportunities for mean reversion trades or breakout plays depending on the context.
High Volume Nodes (HVNs) are price levels with significantly more volume than the surrounding areas. These act as magnets and often become support or resistance because many traders have positions at these levels and will defend them. Price tends to consolidate around HVNs.
Low Volume Nodes (LVNs) are the opposite. These are price levels where very little trading occurred, creating a gap in the volume profile. Price tends to move quickly through LVNs because there's little interest in holding positions there. They represent imbalance, and the market doesn't like to linger in imbalanced zones.
Volume Profile gives you a roadmap of where the market has shown interest and where it hasn't. That information is invaluable for setting targets, stops, and identifying high-probability entry points.
Examples in Action
You can see these ideas in action with the S&P 500 E-mini futures on a 30-minute chart (Sept 22–24, 2025).
-
The Breakout (Sept 22, midday):
Price launches higher with a series of strong green candles. Notice how the volume bars spike during this move and On-Balance Volume (OBV) surges upward. This is a textbook confirmation: buyers are stepping in with conviction, and the breakout has real fuel behind it.
-
The Pause (Sept 23):
After the initial breakout, price drifts sideways. Volume drops and OBV levels off. This isn’t a bearish sign, just the market taking a breather. The lack of strong selling volume shows sellers aren’t yet in control.
-
The Reversal (Sept 24):
Here’s where volume tells an important story. Price starts to roll over, and suddenly red candles appear with heavy selling volume. OBV dives sharply lower. This combination of high volume on the selloff and OBV breaking down is a clear warning that bullish conviction has flipped, and the risk of deeper downside is high.
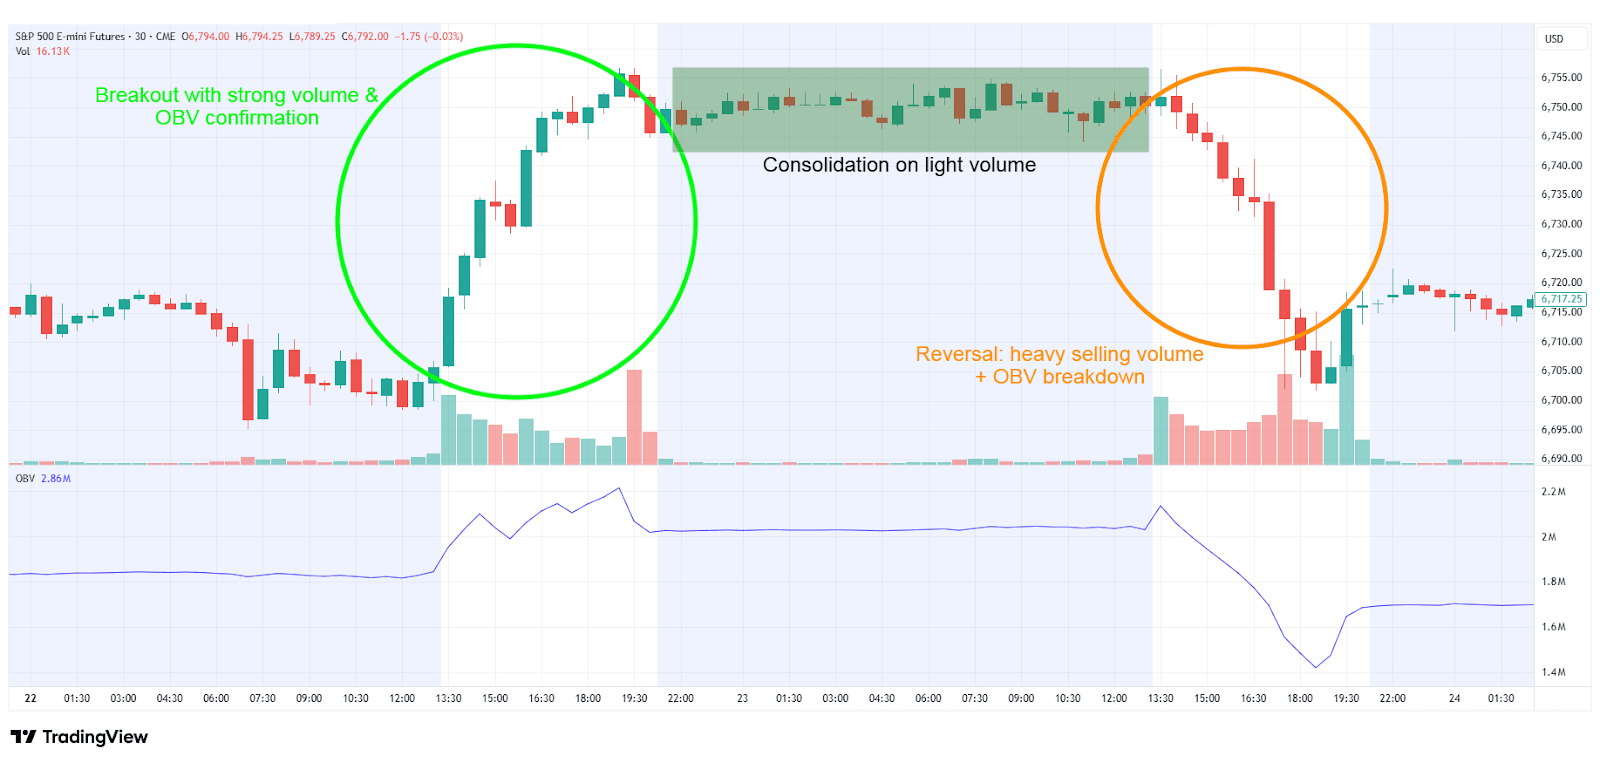
Figure 1. S&P 500 E-mini Futures (CME: ES1!) 30-minute chart, September 22–24, 2025. Source: TradingView.
This sequence demonstrates why volume is so valuable. It not only confirmed the strength of the breakout but also gave an early heads-up when that strength faded and sellers took control.
A Simple Trading Framework
Let's put this all together into a process you can follow every time you analyze a trade.
First, establish context. Is the market trending or ranging? What's the overall structure? Volume analysis doesn't work in a vacuum. You need to know what type of environment you're trading before you can interpret what the volume is telling you.
Second, check the engine. Look at the volume bars and OBV. Is volume confirming the price action, or are you seeing divergence? Is the trend moving with conviction, or is it running on fumes? This step tells you whether you should be leaning into the move or preparing for a reversal.
Third, map your levels. Pull up the Volume Profile and identify the POC, value area, and high and low volume nodes. These levels give you structure. They show you where the market is likely to react and where it's likely to move quickly. Use these zones to plan your entries, exits, and stop placement.
Finally, wait for confirmation. Don't rush into a trade just because the setup looks good. Watch for real-time volume to confirm the move. A breakout might look perfect on paper, but if the volume doesn't show up, the setup is incomplete. Patience here separates profitable traders from those who constantly get caught in traps.
Common Mistakes to Avoid
Even with a solid understanding of volume, it's easy to fall into a few common traps.
The first is treating volume as a standalone indicator. Volume is powerful, but it must always be combined with price action, market structure, and your overall trading plan. Don't overcomplicate things by trying to extract meaning from every tiny volume fluctuation. Focus on the clear, obvious patterns."
The second mistake is ignoring context. Volume naturally varies throughout the day and across different market conditions. Volume during the overnight session typically is lower than during regular trading hours. Holiday periods see reduced participation.
You’ll also notice distinct shifts around contract roll dates and expirations, when traders migrate to the next front-month contract. Volume often dries up in the expiring contract and builds quickly in the new one, which can distort analysis if you’re not paying attention to the rollover. Don't misinterpret these natural variations as a lack of interest in your trade idea. Understand the environment you're trading in.
Finally, make sure you're using the right data. For futures traders, you want to see actual contract volume, not tick volume. Tick volume counts the number of price changes, not the number of contracts traded. It's a poor substitute and can lead to false conclusions. Your charting platform should allow you to display true volume for futures contracts. Make sure it's enabled.
See the Market in a New Light
Volume analysis transforms price from random moves into a story with depth and predictability. You'll start to recognize when trends have real strength behind them and when they're just smoke and mirrors. You'll spot reversals before they fully develop and, most importantly, you'll stop falling for the traps that catch traders who only watch price.
It’s important to note that this isn't a magic bullet. No single tool or technique will make you a consistently profitable trader. But volume analysis, when mastered, gives you a significant edge.
The key now is practice. Start by adding volume bars to your charts if they're not already there. Watch how volume behaves during different market conditions. Add OBV and Volume Profile to your analysis and observe how they interact with price. Over time, these patterns will become second nature, and you'll wonder how you ever traded without them.
This material is provided for educational purposes only and should not be relied upon as trading, investment, tax, or legal advice. All participation in MyFundedFutures (MFFU) programs is conducted in a simulated environment only; no actual futures trading takes place. Performance in simulated accounts is not indicative of future results, and there is no guarantee of profits or success. Fewer than 1% of participants progress to a live-capital stage with an affiliated proprietary trading firm. Participation is at all times subject to the Simulated Trader Agreement and program rules.