Corn might seem like a humble crop, but in futures trading, it ranks among the most liquid and closely watched markets globally. Farmers hedge their harvests with it, ethanol producers depend on it for margins, and hedge funds track every rainfall pattern across the Midwest. The Chicago Board of Trade (CBOT) corn contract serves as a global benchmark, and it offers opportunities that extend well beyond most equity markets if you’re willing to learn its rhythms.
Corn futures represent more than another market to trade. They offer diversification beyond indices and energies while tapping into price movements driven by real, measurable forces. Weather forecasts, government reports, and export demand all create setups you can plan around, and the seasonal nature of agriculture means patterns repeat in ways you can study and refine.
Why Corn Futures Fit Into a Professional Trading Strategy
The U.S. economy runs on corn in ways most people never consider. Beyond food, it fuels ethanol production, feeds livestock, and serves as a raw material for countless industrial products. That widespread use creates constant demand, and any disruption to supply sends ripples through prices. A late spring frost, a dry July, or an unexpected surge in Chinese imports can all move the market significantly, and these catalysts are easier to track than sentiment-driven swings in equities.
Agricultural commodities like corn add a different dimension to your trading experience. During summer months when equity volatility often fades, grain markets tend to heat up as weather becomes the dominant story. This creates trading opportunities when other markets go quiet, and the fundamental drivers are concrete enough that you can build a thesis around them.
Corn also forces you to think beyond the chart. You'll learn to read USDA reports, interpret weather models, and understand how global trade flows affect prices. These skills transfer to every other futures market you'll trade, and teach you to anticipate price moves instead of just reacting to them.
The Corn Futures Contract Explained
All corn futures trade on the Chicago Board of Trade, part of the CME Group, under ticker symbol ZC. Each contract represents 5,000 bushels of #2 yellow corn, with prices quoted in cents per bushel. The minimum tick is one-quarter cent, equal to $12.50 per contract. Corn can easily move 10 to 20 cents in a single session during active periods, translating to $500 to $1,000 per contract.
Trading Hours and Active Contract Months
Corn futures trade electronically on CME Globex during two sessions Sunday through Friday. The most active session runs from 8:30 a.m. to 1:20 p.m. Central Time, when U.S. traders and institutions are active. The market reopens each evening at 7:00 p.m. CT and trades overnight until 7:45 a.m. CT, allowing global participants to react to international news and weather developments.
The most active contract months are March, May, July, September, and December, with July and December typically drawing the heaviest volume since they align with key points in the crop cycle. Most retail and prop traders close positions before expiration since corn futures settle through physical delivery.
Margin Requirements and Position Sizing
Margin requirements for Corn futures are significantly lower than many equity index futures, making the contract accessible to traders with smaller capital bases. Because you control the standard 5,000-bushel contract with a relatively modest performance bond, you can build meaningful size without the heavy capital commitment often required for large index products.
That lower barrier makes it accessible, but you need to respect the tick value and avoid trading too large just because the margin feels manageable. A 40-tick loss equals $500, and if you're not paying attention to position size relative to your account balance, those losses add up fast.
Make sure you know the tick value cold before placing your first corn trade. MFFU's drawdown limits exist to teach this kind of discipline, and corn is an excellent market for learning how to calculate risk per trade with precision.
MyFundedFutures has introduced daily payouts with the rapid add-on for Scale Plan. A limited time offer you can explore now.
What Actually Moves Corn Prices
Corn prices respond to supply and demand in ways that are easier to track than most financial instruments.
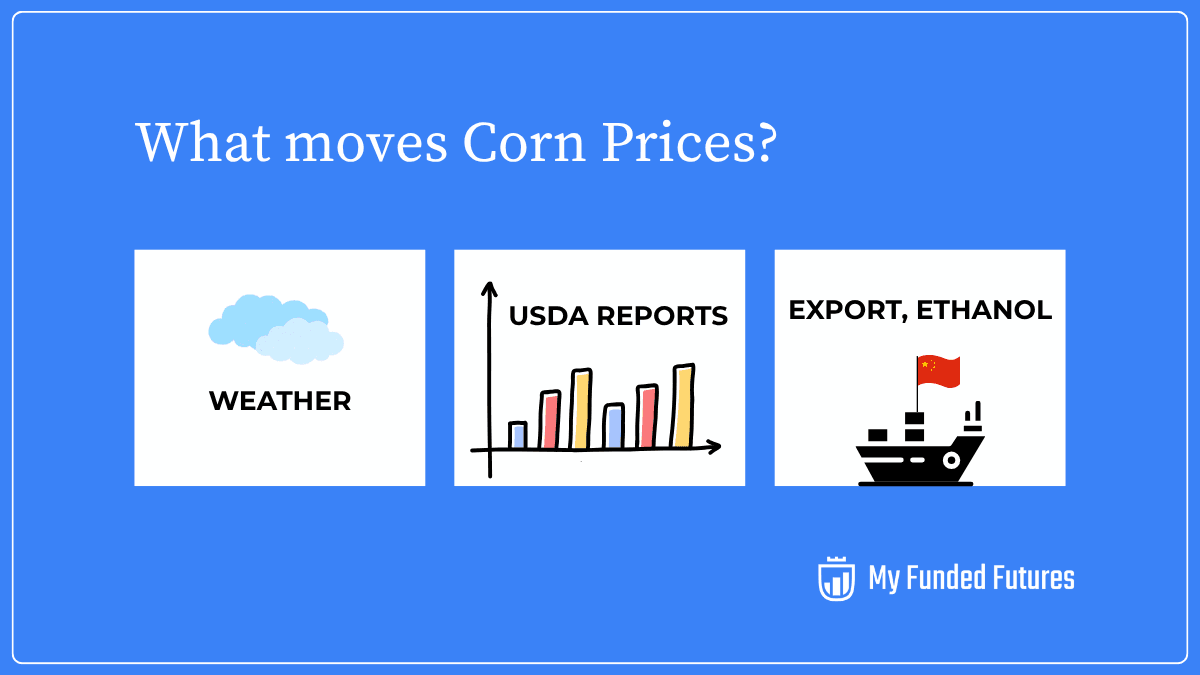
Weather Patterns in the Corn Belt
Weather in the U.S. Corn Belt drives more price action than any other single factor. Iowa, Illinois and Nebraska produce the bulk of America's corn, and what happens in those states between April and September determines whether the harvest will be abundant or disappointing.
Too much rain in spring delays planting, which can compress the growing season and reduce yields. Too little rain in July and August stresses plants during pollination, often sparking sharp rallies as traders price in smaller crops. Excessive rain in fall slows harvest and can damage crop quality, creating volatility as the market reassesses supply.
During key growing months, weather maps move prices more than any technical indicator. You don't need to become a meteorologist, but you do need to know when drought conditions are developing or when a wet pattern is delaying fieldwork. Traders who ignore weather and trade corn purely from chart patterns often find themselves on the wrong side of moves they never saw coming.
USDA Reports and Market-Moving Data
The U.S. Department of Agriculture publishes several reports that corn traders treat like scheduled volatility events. The World Agricultural Supply and Demand Estimates report, released monthly, provides updates on global supply, demand, and ending stocks. These numbers can move the market by 10 or 20 cents in minutes if they differ meaningfully from expectations. Crop Progress Reports track planting and harvest progress throughout the season, and any deviation from normal timelines can shift sentiment. Quarterly Grain Stocks reports update inventory levels, and surprises here can completely reframe the supply picture.
On USDA report days, volume surges, spreads widen, and the market often gaps in one direction before reversing. These are high-octane opportunities, but they demand clear stop placement and the discipline not to chase price after it's already moved. Have your plan in place before the numbers drop, not after.
Export Demand, Energy Prices, and Seasonal Patterns
Export demand adds another layer to corn's fundamental picture. The U.S. competes with Brazil and Argentina for global market share, and when Brazil reports a record harvest, U.S. corn prices often soften as buyers shift attention south. Conversely, strong export demand from China or Mexico can support prices even when domestic supplies look comfortable. The USDA publishes weekly export sales reports every Thursday morning, and traders watch these closely for signs of shifting demand.

Energy prices matter because roughly 40% of U.S. corn goes into ethanol production. When crude oil rallies and gasoline prices rise, ethanol becomes more profitable to produce, which increases demand for corn. This creates a loose correlation between the energy complex and corn.
Corn prices also follow seasonal tendencies that repeat year after year. Prices often bottom in late fall after harvest pressure peaks, then climb into planting season as traders anticipate acreage decisions and potential yield issues. Understanding these seasonal biases helps you time entries and exits with the natural rhythm of supply and demand.
Building a Framework for Analyzing Corn
Successful corn traders treat the USDA calendar the same way equity traders treat earnings season. You need to know when major reports drop, what the consensus expectations are, and how the market has historically reacted. Mark WASDE release dates on your calendar along with weekly crop progress reports and planting and harvest timelines. Planning trades around these events rather than during them keeps you out of the chaotic price action that often accompanies big data releases.
It’s also important to know where to find reliable weather forecasts. The National Weather Service and private forecasting services provide detailed precipitation and temperature outlooks for key growing regions. During summer months, watch for extended dry periods or excessive rainfall, as both can trigger significant price moves. The market often prices in worst-case scenarios before they materialize, so understanding whether weather concerns are legitimate or overblown gives you an edge.
Analyzing volume and open interest tell you whether a move has conviction behind it or if you're watching thin trading create misleading signals. When corn breaks through resistance on heavy volume with rising open interest, new participants are entering the market and the move likely has legs. When price moves on declining volume and falling open interest, you're watching position unwinding rather than new conviction, and those moves often reverse quickly.
Technical Setups That Work in Corn
Range breakouts after USDA reports offer some of the cleanest setups in corn. The market often consolidates for several days leading up to a major report as traders wait for new information. When the numbers hit and the market breaks out of that range on strong volume, you have a high-probability setup with defined risk. Your stop sits just inside the range, and your target is typically one or two times the range's width.
Failed breakouts provide another reliable setup. When corn pushes through a key level but immediately reverses back into the range, it often signals that the move was driven by stops rather than genuine buying or selling interest. Fading these false breakouts with tight stops can produce quick profits as price snaps back toward the other side of the range.
Support and resistance levels matter more in corn than in many other markets because agricultural fundamentals create natural price floors and ceilings. When corn trades near the cost of production, farmers start cutting acreage, which eventually tightens supply. When prices rise too high, demand destruction occurs as buyers switch to cheaper feed alternatives. These fundamental boundaries make technical levels more reliable than they would be in purely financial markets.
Common Mistakes Corn Traders Make
Oversizing positions because of the small tick value. The small tick size in corn tricks traders into thinking they can trade larger positions than they should. A $12.50 tick feels manageable compared to $50 ticks in the E-mini S&P, but the moves add up just as fast. Calculate your risk in dollars, not ticks, and keep position size appropriate for your account balance.
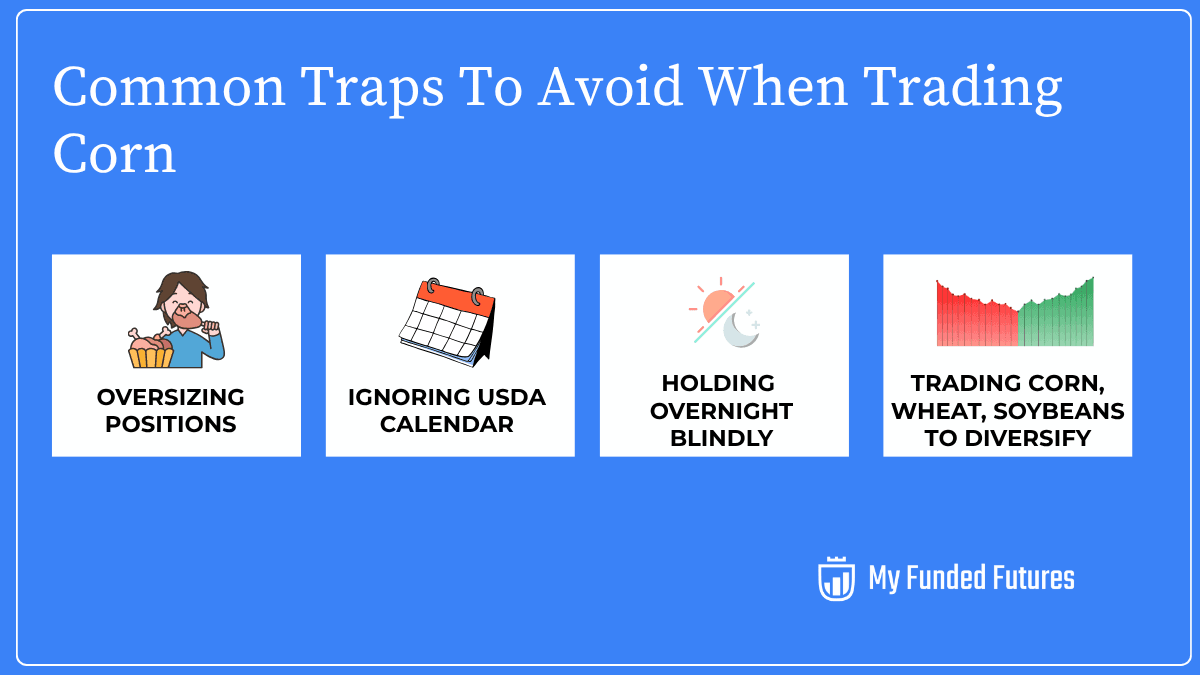
Ignoring the USDA calendar. Corn can gap violently on report days, and if you're caught on the wrong side without a plan, the loss can be significant. You need to know when major data is scheduled because these reports create predictable volatility windows. Keep the calendar handy and plan your trades around it.
Holding overnight without a clear reason. This exposes you to thin liquidity and the risk of waking up to a gap that blows through your stop. If you're going to hold overnight, make sure the potential reward justifies the added risk, and consider reducing position size to account for the uncertainty.
Treating grain positions as diversification. Corn, soybeans, and wheat often move together because they're all agricultural commodities influenced by similar factors like weather and the dollar. If you're holding positions in multiple grains at the same time, you're not as diversified as you think. Manage your correlated exposure carefully to avoid compounding losses when the entire grain complex moves against you.
Building a Repeatable Corn Trading System
Consistency comes from having a system you can trust, and building that trading system requires testing your ideas against real data. Start by collecting historical ZC data covering at least three to five years. You need enough history to see how corn behaves in different market conditions, from drought years to bumper crops.
Mark key events in your data like WASDE days, planting and harvest months, and major weather events. Identify how price reacted to each of these catalysts, noting whether the initial move held or reversed. This historical context shows you which setups have the highest probability of working.
Define your trade setups clearly. For example, you might buy breakouts after three-day consolidations that occur within two days of a USDA report. Or you might focus on mean reversion trades during winter months when corn tends to range. Whatever setups you choose, write down the exact rules for entry, stop placement, and profit targets so you can test them objectively.
Run your rules against historical data using fixed stop and target ratios of at least 1:2. Track metrics like win rate, average profit and loss, maximum drawdown, and expectancy. Expectancy tells you how much you can expect to make per trade on average, and it's the single most important metric for evaluating whether a system is worth trading.
Refine your approach by focusing on one or two setups that fit your trading hours and temperament. If you work during the day and can only trade the evening session, find setups that work in that window. If you prefer slower-paced trades with less screen time, focus on swing setups rather than scalping. The best system is the one you'll actually follow, and that means it needs to match your lifestyle and personality.
Backtesting gives you confidence in your edge. When you hit a losing streak, your backtest reminds you that the system works over time and that short-term losses are part of the process. Traders who skip this step often abandon their strategy after a few bad trades because they never built the conviction needed to stick with it.
Why Trading Corn Makes You a Better All-Around Trader
Agricultural commodities force you to think differently than you would in purely technical markets. You can't just draw trendlines and expect them to hold without understanding what's driving the underlying supply and demand. This requirement to blend technical and fundamental analysis makes you a more complete trader.
Corn teaches you to respect economic cycles and the seasonal rhythms that govern agricultural production. You learn to time your entries around volatility windows when the market is most receptive to moves in your direction. You develop precision in managing positions because the tick size and volatility demand it.
The skills you build trading corn transfer directly to other markets. The discipline required to wait for USDA reports trains you to be patient around earnings in equities. The ability to read volume and order flow in grain markets sharpens your execution in indices. The experience managing risk in a market that can gap against you makes you more cautious and thoughtful in everything else you trade.
Trade Corn Futures Professionally
Corn futures on the CBOT offer everything a serious futures trader needs to build a sustainable edge. The market is liquid, transparent, and driven by factors you can research and understand. The seasonal patterns repeat year after year, giving you a framework to refine and improve. The tick size and margin requirements make it accessible without being trivial, and the fundamental catalysts create setups you can plan around.
If you're trading with MyFundedFutures, you already have access to the tools and capital you need to make corn part of your strategy. The platform connections work seamlessly, the evaluation rules give you room to trade your system, and the profit splits reward traders who prove they can manage risk while building consistent results.
Whether you focus on intraday breakouts around reports or longer-term seasonal swings, the market offers enough variety that you can find setups that match your style. Start small, track your results, and let the data tell you what works. Every trade teaches you something, and every day you manage risk like a professional brings you closer to building the kind of funded account that changes your financial future.
Ready to prove your edge in one of the world's most dynamic commodity markets? Check out our MyFundedFutures evaluation programs and start trading corn futures with professional capital backing you from day one.
¹This material is provided for educational purposes only and should not be relied upon as trading, investment, tax, or legal advice. All participation in MyFundedFutures (MFFU) programs is conducted in a simulated environment only; no actual futures trading takes place. Performance in simulated accounts is not indicative of future results, and there is no guarantee of profits or success. Fewer than 1% of participants progress to a live-capital stage with an affiliated proprietary trading firm. Participation is at all times subject to the Simulated Trader Agreement and program rules.
Rate this article
Related Posts
Read our most popular posts

What is MyFundedFutures Flex Account and is it the Right Plan for You?
The Flex Plan offers low-cost access, minimal restrictions, flexible risk rules, and a clear, structured path from simulation to live trading.

Gold vs. Silver Futures: Key Differences and Which Should Beginner Traders Choose?
Precious metals are rallying on economic and geopolitical uncertainty; while futures offer leverage, gold’s stability and liquidity make it a safer starting point than silver for beginners.

What Is MyFundedFutures Scale Account and Is It The Right Plan For You?
The MyFundedFutures Scale Account is a middle-tier evaluation plan that balances affordability with growth potential. The scale plan offers weekly payout opportunities with increasing withdrawal limits, no daily loss cap, and a clear path to live funding after just five consecutive payouts.